Background
Images can be used for quantitative assessment using image analysis methods and algorithms. Canfield’s VAESTRO Image Analysis Toolkit is developed for objective, quantitative assessment of facial features, such as wrinkles, sun damage, hyperpigmentation, porphyrins and various other parameters.
Purpose
The purpose of the experiment described herein is to demonstrate the capability of VAESTRO in providing reliable and reproducible feature detection and measurements.
Objectives
To evaluate VAESTRO (v2.1.1) Image Analysis Toolkit capabilities to reproduce feature detection in a defined region of interest (ROI) over multiple time points.
Methodology
Image capture
A Canfield Scientific, Inc. VISIA-CR v2.2 (Figure 1) was used to capture 2D images of the subject’s face. Mirror 7.3.10 software was used to interface with VISIA-CR and for image management.
Ten (10) subjects with various facial features were photographed. Clinical, cross-polarized and UV fluorescence images were captured of subjects’ left, front and right views. Each subject was photographed four (4) times. For testing reliability and reproducibility of feature detection algorithms in VAESTRO, the initial captured image is considered the baseline and the three (3) subsequent captured images are considered follow-ups. Between each image capture, the subject relaxed and was repositioned into the VISIA-CR system by the technician using the MatchPose image overlay capabilities of the Mirror software. Capturing images using this method added subject positioning variability to the measurements.
Case Study
A simple in-house experiment looking at three (3) subjects, treated with commercially available anti-wrinkle silica base serum. Each subject is shown with and without feature detection overlay, before treatment on the left, after treatment on the right.
Product efficacy determined from VAESTRO wrinkle analysis shows an average of 34.8% improvement. Quantitative assessment correlates with visual assessment.
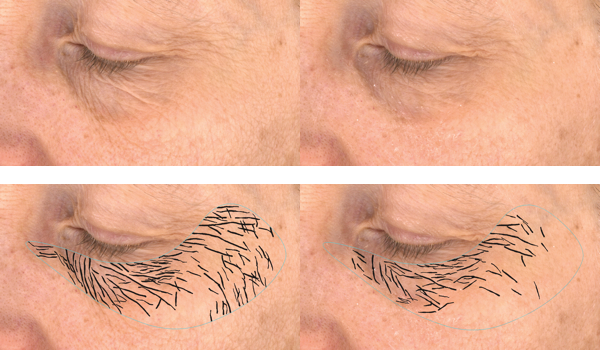
Subject 3: 42.7% reduction
Image analysis
VAESTRO (v2.1.1) Image Analysis Toolkit was used to quantify facial features from images captured with the VISIA-CR. Although VAESTRO is capable of applying various threshold and sensitivity parameters, the default settings were used in this experiment.
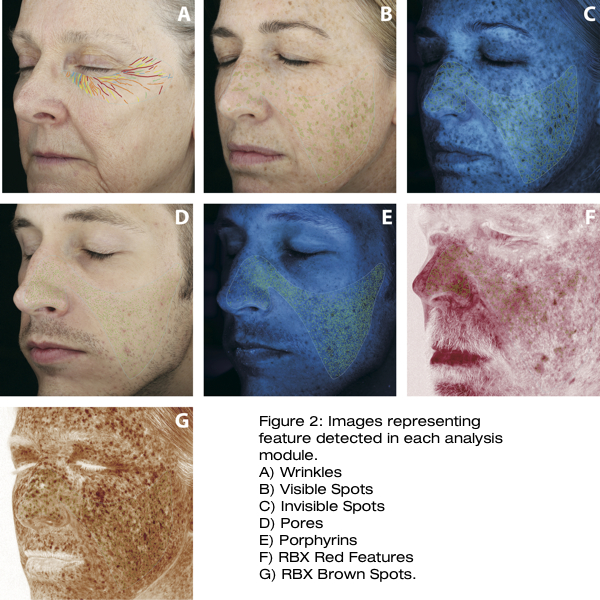
The subjects’ left and right view images were analyzed for the following facial features: wrinkles, visible spots, invisible spots, pores, porphyrins, red features and brown spots (Figure 2). The total area of the detected feature for each analysis module was compiled. This represents a cumulative measurement value of the detected features within the masked region of interest (ROI). Percent Coefficient of Variation (CV) of the detected features was calculated across all visits for each subject and view. CV is calculated as the ratio of the standard deviation to the mean, and shows variability in the measured data. The lower the CV, the smaller the variability.
One should note that the reported CV is of the entire system, including image capture, subject positioning and image analysis.
To confirm stability of the image analysis algorithms, a test / re-test analysis was also performed. In order to do this, the same image was analyzed multiple times by a feature detection module and the measurements were compared.
Results
The results of the replicate measurements from the test / re-test experiment were an exact match for each of the algorithms. Percent Coefficient of Variation (%CV) was reported for left and right views of each subject (Table 1).
Table 1: VAESTRO image analysis precision for each analysis
| Analysis Module | % CV |
| Wrinkles | 2.90% |
| Visible Spots | 1.82% |
| Invisible Spots | 1.30% |
| Pores | 2.11% |
| Porphyrins | 2.74% |
| Red Features | 2.74% |
| Brown Spots | 2.91% |
Summary
All of the results report a CV less than 3%. We expect an even lower CV with larger population.
In conclusion, quantitative analysis of facial features can be used as a primary end-point for product/treatment efficacy. The high precision of image analysis presented here demonstrates VAESTRO to be a powerful tool in facial feature assessment.
Appendix 1 – image analysis modules
Wrinkle analysis — The Wrinkle Analysis Algorithm performs quantitative analysis and scoring for assessing the severity of facial wrinkles and fine lines. The analysis algorithm operates on a high-resolution VISIA-CR image captured in Standard II imaging modality (uniform white light).
Visible Spot analysis — The Visible Spots Analysis Algorithm performs quantitative analysis and scoring for spots visible under the standard daylight conditions. The analysis algorithm operates on a high-resolution VISIA-CR image captured in the Standard II imaging modality.
Invisible Spot analysis — The Invisible Spots Analysis Algorithm performs quantitative analysis and scoring for hyperpigmented spots that are visible under UV or Blue light. The analysis is performed on a high-resolution VISIA-CR image captured with the UV-fluorescence or Blue light excitation imaging modality.
Pore analysis — The Pores Analysis Algorithm provides quantitative analysis and scoring for visible facial pores. The analysis algorithm operates on a high-resolution VISIA-CR image captured in Standard II imaging modality.
Porphyrin analysis — The Porphyrins Analysis Algorithm provides quantitative analysis and scoring for Porphyrins that are visible as bright spots in a UV or Red image. The analysis algorithm operates on a high-resolution VISIA-CR image captured with the UV-fluorescence or red imaging modality.
RBX Red Feature analysis — The RBX Red Features Analysis Algorithm provides quantitative data for small red spots and vascular features. The analysis is performed on a high-resolution VISIA-CR image captured with the Cross-Polarized imaging modality.
RBX Brown Spot analysis — The RBX Brown Spots Analysis Algorithm provides quantitative data based upon the RBX Brown image. RBX Brown Spots Algorithm marks the areas of high concentration of hyperpigmented spots. The analysis is performed on a high-resolution VISIA-CR image captured with the Cross-Polarized imaging modality.